In this project, I will explore fitting a running linear model as well as running predictions.
During my bachelor’s project, I focused on the prediction of time series. The model I used was fitted using least squares. I worked with FFP3, which is implemented in R.
At that time, I used the Forecast package but ended up implementing the estimator from the ground up. As I have improved my programming and mathematical skills, I thought it would be fun to revisit this problem and see if I could develop a better solution.
Rob who wrote FFP3, has a blog their i sais their is trick to speeding op the calculation of rolling predition for AR process, and I think I figured it out.
Lest squres can be written as
\[\underset{\beta}{argmin} ||Y-X\beta||^2\]
Since this is a linear function the problem above i convex with one uniq closed form solution
\[\hat{\beta}=(X^TX)^{-1}X^TY\]
Running Prediction
When using a running model, a simple solution is to add a new data point and fit the model again. This approach works but is not very efficient.
Instead, let’s consider whether we can update the \(\beta\) estimates directly.
For \(B=X^TY\) the udpate rule is \[B=(X_{new}^TY_{new})=(X_{old}^TY_{old})+x_{new}*y_{new}\]
note here that \(y_{new}\) act as a scale
Use Cases
Rolling prediction can be used for the evaluation of time series.
However, these techniques can also be used for the quick implementation of a sliding window estimator or to update a linear model as new data arrives. Additionally, this method provides a fast approach for leave-one-out evaluation of predictive strength.
I will create one implementations, where I use this for rolling prediction.
The method could be used for making a implements of a sliding window.
For the sliding window, it is necessary not only to add the new row but also to remove the old one.
def rolling_prediction(x: list, y: list, starting_length: int):# Ensure x is 2D array with shape (n_samples, n_features) x_array = np.array(x).reshape(-1, 1) iflen(np.array(x).shape) ==1else np.array(x) y_array = np.array(y).reshape(-1, 1) iflen(np.array(y).shape) ==1else np.array(x) length =len(x_array) prediction = np.zeros(length - starting_length) los_score = np.zeros(length - starting_length)# Initialize A and B matrices initial_x = x_array[:starting_length] initial_y = y_array[:starting_length] A = np.linalg.inv(initial_x.T @ initial_x) B = initial_x.T @ initial_y# Initial prediction next_x = x_array[starting_length].reshape(1, -1) prediction[0] = get_prediction(A, B, next_x) los_score[0] = y_array[starting_length] - prediction[0]# Rolling update for predictions and loss scores ind = starting_length +1 current_x = x_array[ind].reshape(1, -1) for i inrange(length - starting_length -1): ind = starting_length + i current_x = x_array[ind].reshape(1, -1) # Update matrices A = get_inverse_updated_matrix(A, current_x) B = get_matrix_update_B(B, current_x, float(y_array[ind]))# Make prediction for next point next_x = x_array[ind +1].reshape(1, -1) prediction[i +1] = get_prediction(A, B, next_x) los_score[i +1] = y_array[ind +1] - prediction[i +1]return {"prediction": prediction, "los_score": los_score}
Testing the Application
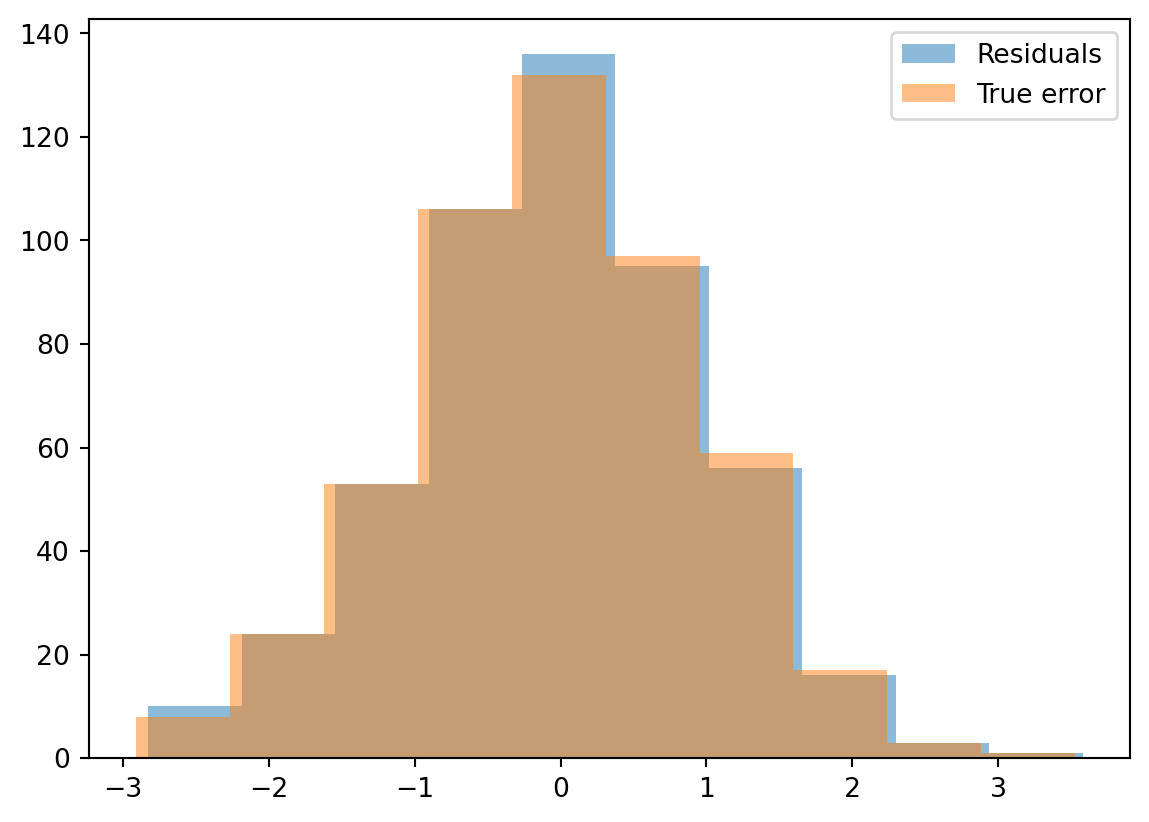
Since the underlying model is not changing, this provides a straightforward way to test the model. The residuals should closely resemble the errors.
However, they will not be identical, as this would require the coefficients to be perfectly accurate.
Code
import warningswarnings.filterwarnings("ignore")#Dianostic plot import matplotlib.pyplot as pltstart_val=500x = np.random.rand(1000) error=np.random.normal(size=1000) y =2*x + error# Run the predictionresult = rolling_prediction(x, y, start_val)plt.hist(result['los_score'],alpha=0.5)plt.hist(error[(start_val):],alpha=0.5)plt.legend(["Residuals", "True error"])plt.show()
When the Application Fails
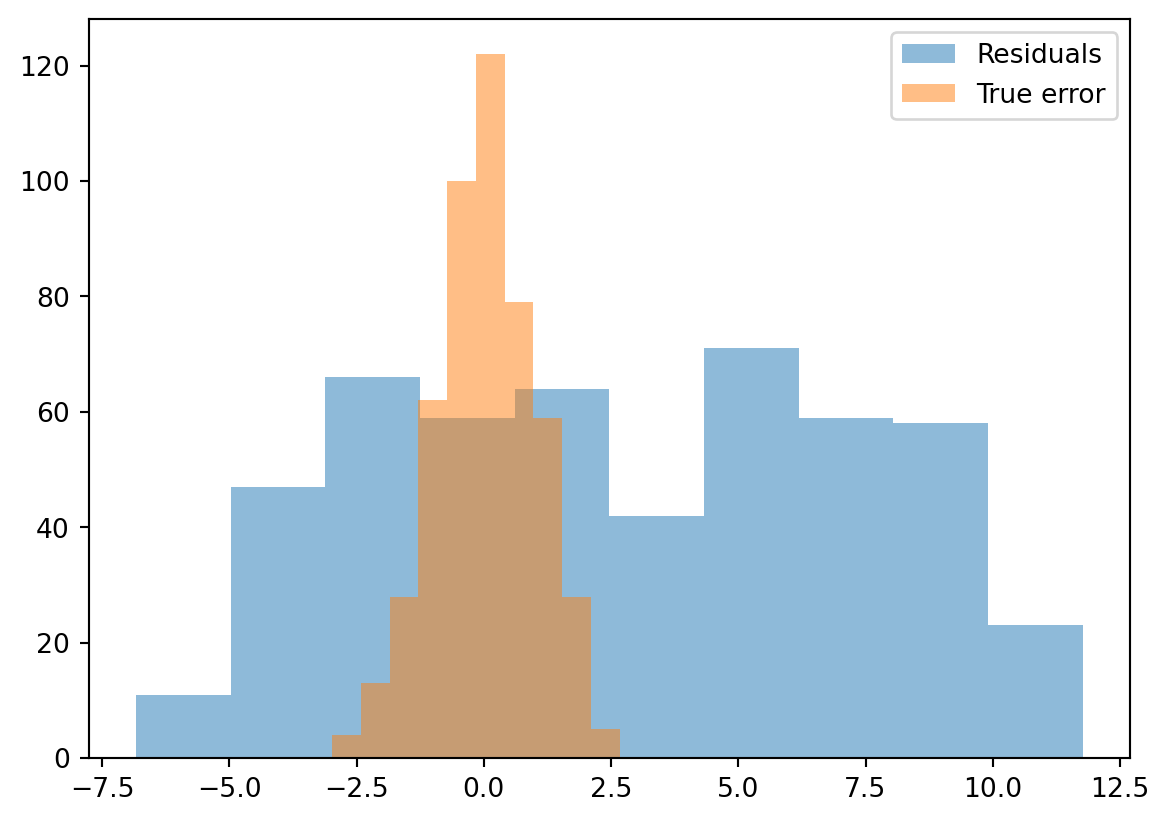
The reader should note that I have not included an intercept in the data-generating process. Below, I have conducted the same test, but this time I have added a constant to the expression.
Code
import warningswarnings.filterwarnings("ignore")#Dianostic plot import matplotlib.pyplot as pltstart_val=500x = np.random.rand(1000) error=np.random.normal(size=1000) y =10+2*x + error# Run the predictionresult = rolling_prediction(x, y, start_val)plt.hist(result['los_score'],alpha=0.5)plt.hist(error[(start_val):],alpha=0.5)plt.legend(["Residuals", "True error"])plt.show()
As can be see now the aplication fails.
This can be fixed by adding a column of ones to the model matrix. I would also need to update all the functions to accommodate this change. Without adjusting for this, the dimensions will not match when adding the point to the inverse.
I will stop the project here. This was intended to be a small NumPy project. If I were to create functions that allow specifying a model, I might develop it more properly and let the user specify the model through an expression, similar to how linear models are specified in R. Since all model specifications in linear models are based on modifying the model matrix, this could provide flexibility.